Exploratory data analysis (EDA) is a crucial part of data science, during which we look at the size of the dataset and the variables within, the distributions of the variables, and the relationships between these variables. We also want to identify missing data and outliers. The EDA step informs us on where a project should go next:
- Are the current features enough or should I engineer additional features?
- Which features should I use in my models?
- Which models should I select?
And so on.
In a series of blogs, I will describe the EDA I regularly perform on data science projects.
For this blog, I will talk about the describe method in pandas, which is really useful when it comes to get a lay of the land.
Both the DataFrame class and the Series class have a describe method. I will focus on the former, especially when the DataFrame contains mixed dtypes.
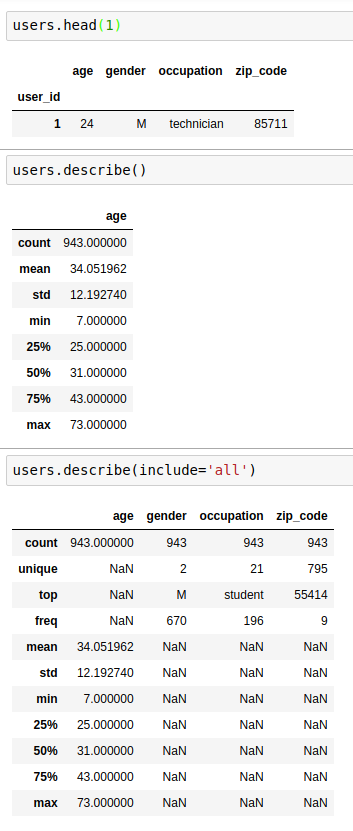
When no argument is specified and the DataFrame contains numeric data, df.describe() gives you the count, mean, std, min, max as well as 25, 50 and 75 percentiles on the numeric columns (non-numeric columns, even if present, are not summerized).
When you have a DataFrame with mixed data types, and you want to see summaries on every column, df.describe(include='all') includes a union of attributes (count, unique, top, and freq, in addition to the abovementioned attributes; as well as first and last items if there are timestamps). I find neither of these satisfactory. The former does not provide summary on every column, and what the latter returns is too busy and has too many NaN.
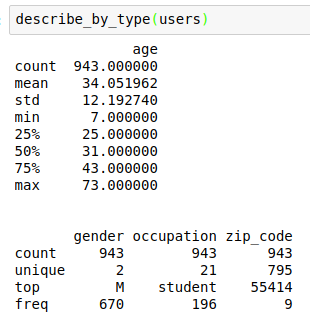
To this end, I have written the following function to summarize each column in the DataFrame according to its dtype.
Here is what it looks like when used on the same DataFrame in the example above:
I hope you find the code useful!