In the first blog of this series, I’ve talked about how to use the describe method in pandas to get a sense of the distributions of the data.
While describe gives a pretty comprehensive summary on numeric data, the same thing cannot be said about categorical data.
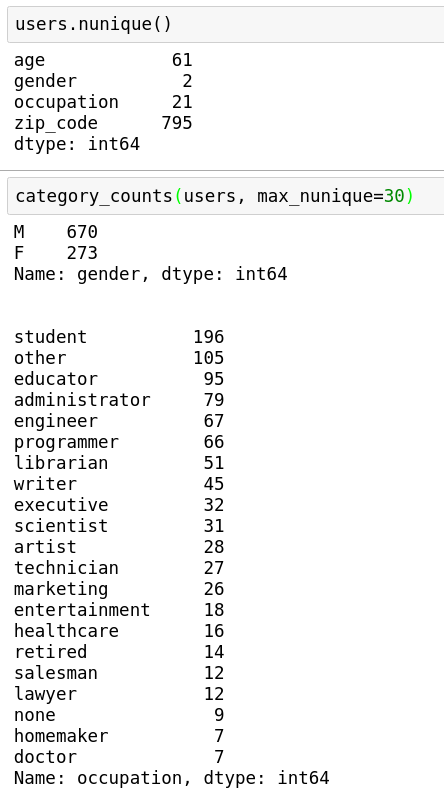
For this purpose, the value_counts method for the Series class is quite handy.
I’ve written a wrapper function for it for easier control:
Here is what it looks like when used on the same DataFrame used in the first blog of the series:
As a side note, checking value counts is especially important when you are dealing with a classification problem.
Remember to check the value counts of the outcome variable, as well as the ratio (y.value_counts() / len(y); or y.value_counts() / float(len(y)) if you’re still using Python 2 — but seriously, switch to Python 3 already!).
This way, you’ll know if you’re dealing with unbalanced classes, and the baseline of your accuracy score.
That’s it for today. I’ll wrap up the EDA series in my next blog post.