One basic yet often effective approach in exploratory data analysis I have not mentioned in my EDA series (I, II, III) is visually inspecting the raw data:
- check the column names (and understand what they mean)
- check the values — Are they numbers, characters, etc.? Do they make sense?
To do this, pandas has two DataFrame/Series methods, head and tail, that allow you to see the first/last few rows (5 if not specified).
If you want to look at a few rows at random, you can use the sample method.
It may also be used when working with a large dataset: you can first use sample to generate a random subset, develop your code on that, then apply your code to the full dataset.
There is also a method called info that I absolutely adore.
Simply running df.info() gives you information on the DataFrame’s shape, indices, column names, number of non-null values in each column, and the data types.
Here is an example:
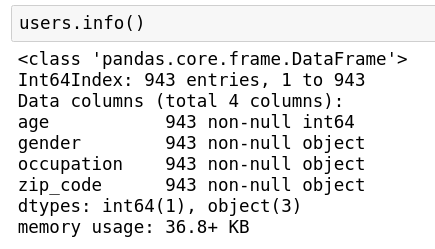
Note: Do not confuse this with the info attribute (df.info).
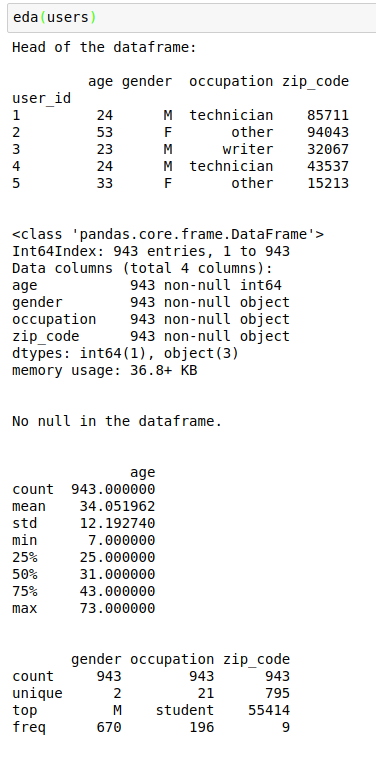
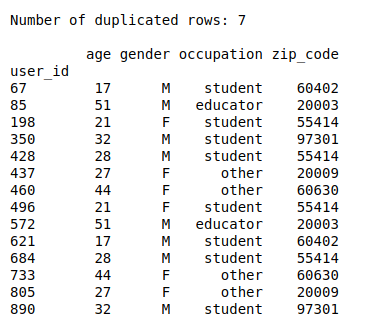
To wrap up the EDA series, here is the customized eda function I use whenever working on a new dataset:
Note that I’ve made each part (head, info, describe, duplicated) modular so you can toggle anyone of them on or off.
And here is an example of the output:
That’s it! Hope you’ve enjoyed the EDA series!